ALBUQUERQUE, N.M. — Sandia National Laboratories researchers, as part of a group of National Nuclear Security Administration scientists, have wrapped up years of field experiments to improve the United States’ ability to differentiate earthquakes from underground explosions, key knowledge needed to advance the nation’s monitoring and verification capabilities for detecting underground nuclear explosions.

The nine-year project, the Source Physics Experiments, was a series of underground chemical high-explosive detonations at various yields and different depths to improve understanding of seismic activity around the globe. These NNSA-sponsored experiments were conducted by Sandia, Los Alamos National Laboratory and Lawrence Livermore National Laboratory and Mission Support and Test Services LLC, which manages operations at the Nevada National Security Site. The Defense Threat Reduction Agency, the University of Nevada, Reno, and several other laboratories and research organizations participated on various aspects of the program.
Researchers think recorded data and computer modeling from the experiments could make the world safer because underground explosives testing would not be mistaken for earthquakes. The results will be analyzed and made available to many institutions, said Sandia principal investigator and geophysicist Rob Abbott.
The dataset is massive. “It’s been called the finest explosion dataset of this type in the world,” Abbott said. “We put a lot of effort into doing this correctly.”
The final underground explosion in the series took place June 22.
Experiments explored differences between explosions in hard, soft rock
Phase 1 of SPE consisted of six underground tests in granite between 2010 and 2016. Phase 2 consisted of four underground tests in dry alluvium geology, or soft rock, in 2018 and 2019. The results from both phases will be analyzed to help determine how subsurface detonations in dry alluvium compare to those in hard rock. Additionally, the SPE data can be measured against data collected from historic underground nuclear tests that were conducted at the former Nevada Test Site.

Depending on the experiment, up to 1,500 sensors were set up to take measurements. These diagnostics include infrasound, seismic, various borehole instruments, high-speed video, geological mapping, drone-mounted photography, distributed fiber-optic sensing, electromagnetic signatures, gas-displacement recordings, ground-surface changes from synthetic-aperture radar and lidar (which measures distance using lasers), and others. Accelerometers were set up in multiple locations around the explosion, along with temperature sensors and electromagnetic sensors.
“The data is designed to eventually be freely available to anybody, so that any other researcher from any country can use the data to understand these events,” Abbott said.
The project is also serving as a training ground for the next generation of nonproliferation scientists and engineers, with student interns from 14 different universities and colleges coming to Sandia to work with the data, he said.
Understanding seismic readings is key in differentiating subsurface events
Satellites essentially eliminate the possibility of surface nuclear testing going unnoticed anywhere in the world, but underground testing is more difficult to detect and characterize due to limited access and visible characteristics, and difficulty discriminating nuclear explosions from other types of seismic events, said Zack Cashion, chief engineer for Phase 2 of the project.
When scientists study earthquakes, they look at compressional waves (primary or P-waves) and shear waves (secondary or S-waves). Abbott said explosions typically produce more P-waves relative to S-waves when compared to earthquakes.
Prior to SPE, scientists noticed that some foreign underground nuclear tests looked more earthquake-like when compared to previous nuclear explosions around the world, which indicated more experimental knowledge was needed to improve modeling and the ability to track global testing, Abbott said.

“The only way to understand that better, in our opinion, was to do actual physical experiments,” Abbott said. “We couldn’t just simply have new modeling codes without something to test those new modeling codes against.”
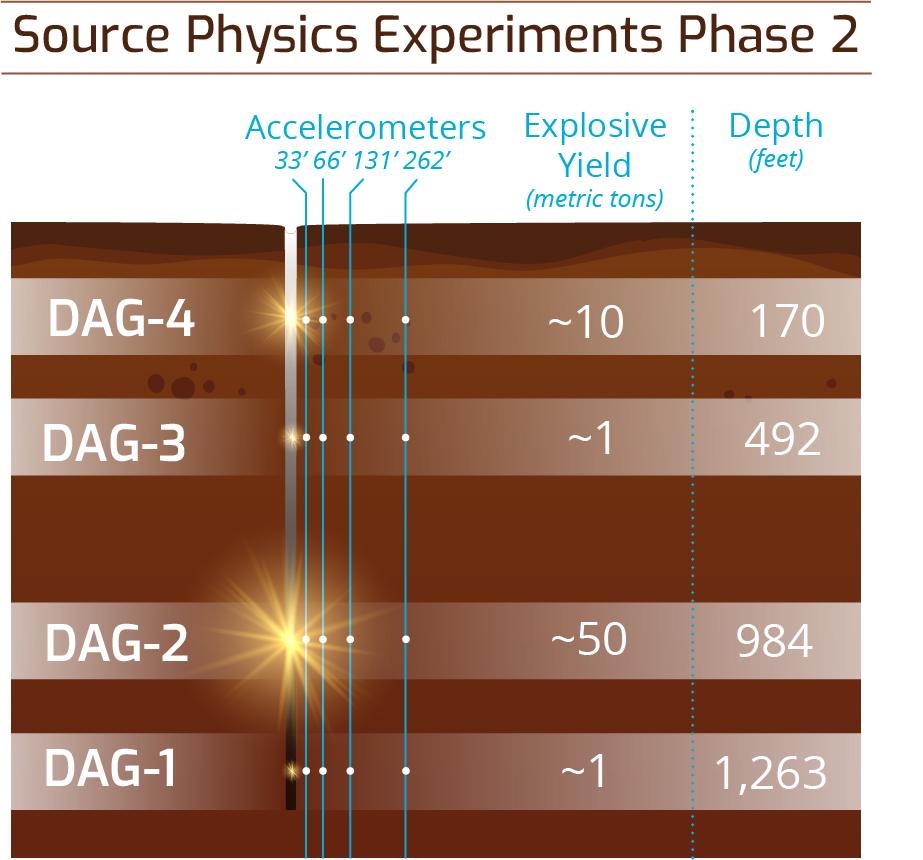
In both SPE phases, one hole was used to hold multiple explosive devices of different yields. In Phase 2, the hole was 8 feet in diameter and originally 1,263 feet deep. For the first Phase 2 experiment that took place last summer, an explosive canister containing about a 1-metric ton TNT equivalent of nitromethane was lowered into the hole and covered with a careful design of gravel, sand and cement. Consecutive experiments used the same hole and explosives in the amounts of 50-metric tons, 1-metric ton, and 10-metric tons of TNT equivalence were lowered where the gravel and sand left off from the previous experiment.
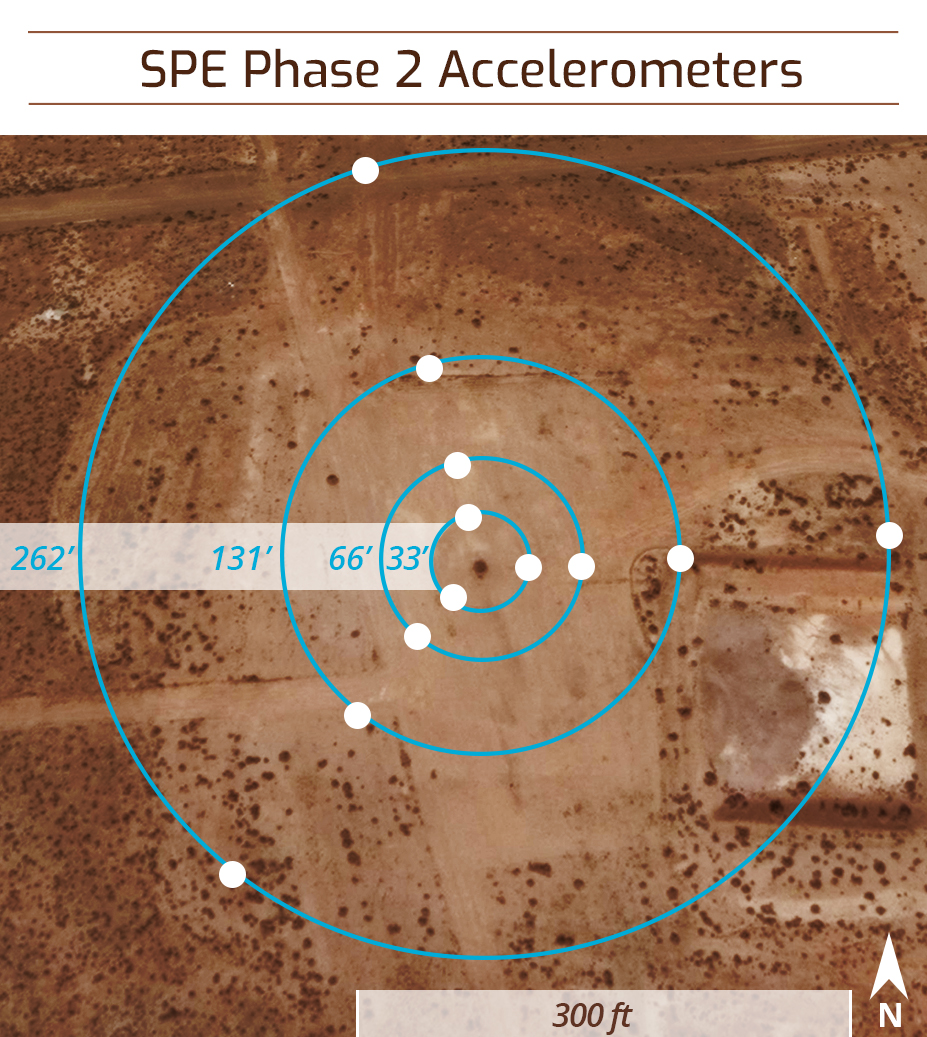
Cashion led the design of the instrumentation and borehole accelerometers that captured data for the second phase of the experiments. Twelve instrumentation boreholes were drilled on 120-degree azimuths on four radial rings that were 33, 66, 131 and 262 feet from the test hole. The instrumentation holes were filled with 58 instrumentation modules, each containing a set of accelerometers, magnetometers, gyroscopes and temperature sensors.
The goal for every experiment was to gather high-quality data from as many sensors as possible. On test day when everyone is in place, Cashion said the mood becomes intense.
“It is time to execute on plans that have been discussed for months or years that required monumental group effort and coordination to implement and it all comes down to one moment,” he said. “You’re sitting there watching your screen and it’s ‘Three, two, one, fire,’ and then you might not feel anything. Depending on the system, you might not even see anything change on your screen until after the duration of recording is complete. You’re waiting there for, it might be four seconds, but it feels like an eternity, and then you go look at the data and wipe your brow that the event occurred as planned and that it was indeed recorded.”
Researchers work to determine explosion depth, size

Sandia National Laboratories scientist Danny Bowman measured SPE sound waves using ground and airborne microphones. He said when events take place underground and make the ground surface move, the earth acts as a giant speaker and can transmit sound.
“We know earthquakes do this,” Bowman said. “In this test series, we tried to understand how this takes place, how we can use the properties of sound to determine how big the explosion was and how deep it was.”
Most infrasound data was gathered from ground sensors setup for the experiments, and Bowman said there were some surprises throughout SPE. When tests took place in granite, scientists learned they could use sound to determine the size and depth of the explosion, he said, but dry alluvium geology provided no predictive power. And even though explosions were larger in Phase 2, they didn’t always provide infrasound.
“Our task in the next couple years once all the data is collected, and we have a chance to analyze it, is to take this exceptional dataset and derive some predictive power from it,” Bowman said. “I believe that’s possible, but we’re in the trenches right now. We don’t have the bird’s eye view of it.”
The work has been fulfilling, said Abbott, who has worked on SPE since the beginning of Phase 1. Cashion agreed, saying the results come from a large, collective team effort.
“I remember being a kid and watching space launch movies and wanting to be one of those people in the room looking at a screen and caring about your little detail of this huge project and wanting to see that it worked,” Cashion said. “It really is an experience like that. When it’s game time, everybody wants to win. We’re all there together as a team and everyone wants to see it go well.”
